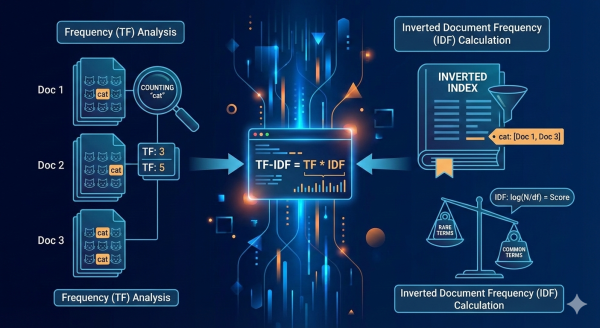
Understanding how computers “read” and understand text is a fascinating field. One of the most fundamental techniques for identifying important keywords in a document, relative to a collection of documents, is TF-IDF (Term Frequency-Inverse Document Frequency).
I recently embarked on a gamified learning challenge to demystify TF-IDF, breaking it down into its core components. This post summarizes my adventure!
The Core Idea: Why TF-IDF Matters#
Imagine you have a huge library of books. If you want to find out what a specific book is really about, just looking at words that appear frequently isn’t enough. “The” or “is” might appear often, but they tell you nothing unique. TF-IDF helps us find words that are:
- Frequent within a specific document (TF)
- Rare across the entire collection of documents (IDF)
When a word meets both criteria, it’s likely a powerful keyword that defines that document’s content.
Level 1: Term Frequency (TF) – How Often Does a Word Appear?#
Term Frequency is the simplest part. It’s just a count of how often a word (term) appears in a document, normalized by the total number of words in that document.
Formula:
$$ \text{TF}(t, d) = \frac{\text{Number of times term } t \text{ appears in document } d}{\text{Total number of words in document } d} $$Example:#
Let’s say we have Document A:
“The cat sat on the mat. The cat is black.”
- Total words in Document A: 10
- Term ‘cat’ appears: 2 times
Calculation:
$$ \text{TF}(\text{cat}, \text{A}) = \frac{2}{10} = \mathbf{0.2} $$A higher TF means the word is more important to that specific document.
Level 2: Inverse Document Frequency (IDF) – How Unique is a Word Across Documents?#
Here’s where TF-IDF gets clever. IDF helps us ignore common words (like “the”) that appear in almost every document. It assigns a higher score to words that are rare across our entire collection of documents (our “corpus”).
Formula (General form):
$$ \text{IDF}(t, D) = \log \left( \frac{\text{Total number of documents } N}{\text{Number of documents containing term } t} \right) $$Our Corpus (4 Documents):
- D1: “The cat sat on the mat.”
- D2: “The dog chased the frisbee.”
- D3: “I like my cat.”
- D4: “My neighbor’s cat is cute.”
Calculations (using natural logarithm):
- For ‘cat’: Appears in D1, D3, D4 (3 documents out of 4)
- For ‘frisbee’: Appears in D2 (1 document out of 4)
Notice: ‘frisbee’ (rare) gets a much higher IDF than ‘cat’ (relatively common).
Level 3: The TF-IDF Score – Combining Frequency and Uniqueness#
The final TF-IDF score is simply the product of TF and IDF. This score highlights words that are both frequent in a document and unique across the corpus.
Formula:
$$ \text{TF-IDF}(t, d, D) = \text{TF}(t, d) \times \text{IDF}(t, D) $$Putting it Together:#
- TF for ‘cat’ in Document A: 0.2
- IDF for ‘cat’ in Corpus: 0.287
- Hypothetical TF for ‘frisbee’ in a document: 0.1 (e.g., if ‘frisbee’ appeared once in a 10-word document)
- IDF for ‘frisbee’ in Corpus: 1.386
Result: Even with a lower term frequency, ‘frisbee’ has a higher overall TF-IDF score because its uniqueness (high IDF) boosts its importance.
This is the magic of TF-IDF!