The series#
After the move to Hugo the blog is fast and simple, but it has no front desk: nowhere that says here is what’s new, here is what people keep reading, here is where they come from. So I’m building a small hub, about.samarthya.me, and writing down each piece:
| Part | What it covers |
|---|---|
| 1. Google Analytics (this post) | What it is, why I use it, what’s free, and reading it from code |
| 2. Keeping the numbers honest | What the stats would have said without filtering, and the ranking that fixes it |
| 3. Cloudflare in front | DNS, certificates, redirects and caching for the new subdomain |
| 4. Who is knocking? | How Cloudflare tells people from bots, and what that showed about my traffic |
| 5. Building the site | A Quarto template: pages, side menu, charts, light and dark |
| 6. Shipping it | Uploading a static site to a host I don’t trust, and keeping it fresh |
What Google Analytics is#
Google describes it simply: “a platform that collects data from your websites and apps” and turns it into reports. The mechanics:
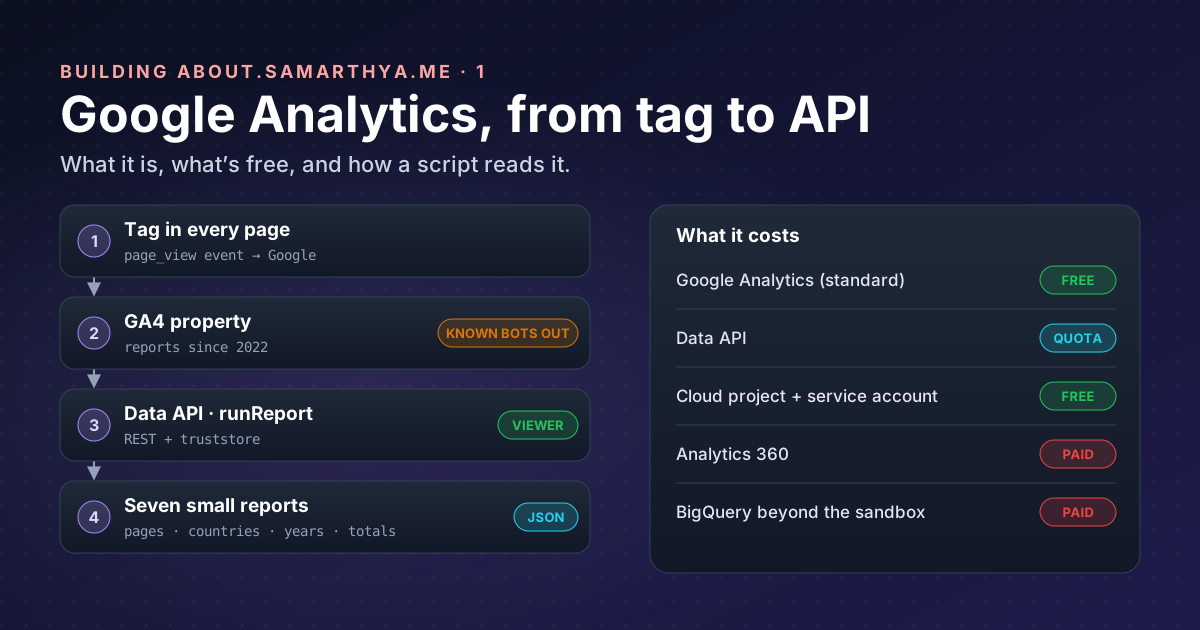
- A small piece of JavaScript, the tag, sits in every page of the blog.
- When someone opens a page, the tag sends an event to Google: page viewed, with the address, the browser’s language, the device type and where the visit came from (a search, a link, nothing).
- Google adds the events up into reports: views per page, visitors per country, time spent reading.
Everything for one site lives in a property. GA4 is short for Google Analytics 4, the current version.
Why I use it#
- A static site can’t count for itself. There is no server program on my side to log a visit; GitHub Pages serves files and that’s all.
- History. The same property has measured the blog since 2022, through the WordPress years and the move. Starting with a new tool would mean starting from zero.
- It’s free for a site of this size, and it has an API, so a script can read it.
It isn’t the only option. Cloudflare Web Analytics is free and “does not collect or use your visitors’ personal data”; part 4 looks at what Cloudflare sees. For now, GA4 has the years of history, so it is the source for the stats page.
What it doesn’t do for me#
GA4 removes known bots automatically, using Google’s research and the IAB’s list of spiders and bots, and you “cannot disable known bot traffic exclusion or see how much known bot traffic was excluded”. Known is the important word. Crawlers that run JavaScript and aren’t on the list are counted as people. Part 2 shows how many of those I had.
What’s free and what isn’t#
| Item | Cost | Notes |
|---|---|---|
| Google Analytics (standard) | Free | Google: “free of charge” |
| Analytics 360 | Paid (sales contract) | Higher limits: 2M API tokens a day, 50 months of exploration data, larger exports |
| Data API | No price, quota-limited | Standard property: 200,000 tokens a day, 40,000 an hour, 14,000 per project per hour; bigger requests cost more tokens |
| Google Cloud project and service account | Free | “All use of Identity and Access Management API is free of charge.” |
| BigQuery export (raw events) | Free in the sandbox, then paid | “Each export will incur costs on the BigQuery side for storage and processing”; not used here |
| Data retention | Free, but limited | Standard: 2 or 14 months, and it “only affects explorations and funnel reports”. Standard reports, which the API reads, keep their totals, which is why I can still read 2022 |
The hidden price is the visitor’s: their visit is recorded by Google. That is part of why the hub publishes only totals (more on privacy below).
Words used in this post#
| Term | Meaning here |
|---|---|
| API | A door for programs: send a structured request, get structured data (JSON) back |
| Dimension / metric | What to group by (page, country, year) / what to count (views, seconds) |
| Google Cloud project | An account container for using Google APIs: it owns the quota and credentials, and here runs nothing |
| Service account | A Google identity for a program, not a person |
| JSON key | The service account’s password, as a file |
| REST | Ordinary HTTPS requests with JSON, the same as a browser fetching a page |
| gRPC | Google’s faster, binary way for programs to call functions on another machine; the client library’s default |
| TLS certificate | What lets your computer check it’s really talking to Google over HTTPS |
Setting it up, step by step#
Google’s quickstart uses your personal login. A script that runs on its own needs a service account instead:
- Create (or pick) a Google Cloud project at the Cloud console.
- Enable the Google Analytics Data API for that project (the quickstart has an Enable button).
- Create a service account: IAM & Admin → Service accounts → Create (Google’s steps). Give it no Cloud roles; its only permission will live inside Analytics.
- Create a JSON key for it and download it.
- Let it read your property: in Analytics, Admin → Property → Access management → + → Add users, paste the service account’s e-mail address and choose Viewer (Google’s steps). Viewer reads reports and changes nothing.
- Install the Python client,
google-analytics-data(0.23.3 at the time of writing):
python -m venv .venv
.venv/bin/python -m pip install google-analytics-data==0.23.3 truststore
Look after the key. Google warns that
service account keys “can become a security risk if not managed carefully”.
Mine sits outside every repository, the script finds it through an environment variable, and .gitignore
blocks key files anyway. If a key is ever committed, deleting the file isn’t enough: delete the key itself in
Cloud IAM, then make a new one.
The first surprise: my antivirus said no#
The first run failed with a certificate error on every call.
Here’s why. My antivirus checks HTTPS traffic by standing in the middle: it opens the connection to Google itself and shows my programs its own certificate. Windows trusts that certificate, so browsers are happy. The client library, though, talks gRPC by default, and gRPC brings its own list of trusted certificates instead of asking Windows, so it refused the antivirus’ certificate.
The fix is two lines: talk REST (plain HTTPS) instead, and let Python trust what Windows trusts with
truststore:
import truststore
truststore.inject_into_ssl()          # Python's HTTPS now uses the Windows certificate store

from google.analytics.data_v1beta import BetaAnalyticsDataClient

client = BetaAnalyticsDataClient.from_service_account_file(KEY_PATH, transport="rest")
Same API, same answers, slightly slower, which doesn’t matter for seven requests.
The questions I ask#
Each report is one call to
runReport.
A helper keeps them short:
from google.analytics.data_v1beta.types import (
    DateRange, Dimension, Metric, OrderBy, RunReportRequest)

def report(client, dims, mets, start, order=None):
    req = RunReportRequest(
        property=f"properties/{PROPERTY_ID}",
        dimensions=[Dimension(name=d) for d in dims],
        metrics=[Metric(name=m) for m in mets],
        date_ranges=[DateRange(start_date=start, end_date="today")],
        order_bys=[OrderBy(metric=OrderBy.MetricOrderBy(metric_name=order), desc=True)] if order else [],
        limit=10000,
    )
    return [([d.value for d in r.dimension_values], [float(m.value) for m in r.metric_values])
            for r in client.run_report(req).rows]
Dates can be exact (2022-01-01) or
relative (28daysAgo, today).
The field names come from the
API schema:
| Question | Dimensions | Metrics | Window | Saved as |
|---|---|---|---|---|
| How much is each page read? | pagePath | screenPageViews, userEngagementDuration | 28 days, 90 days, since 2022 | pages.json |
| Where do readers come from? | country, countryId | engagedSessions | since 2022 | countries.json |
| How did each year go? | year | activeUsers, engagedSessions | since 2022 | years.json |
| Headline totals | none | activeUsers, screenPageViews, engagedSessions | since the new site, since 2022 | totals.json |
That’s seven calls. userEngagementDuration is the total seconds a page was on screen, so dividing by views
gives the average reading time per view. Part 2 shows why that number ended up mattering most.
Before writing any code, try each query in Google’s GA4 Query Explorer, which runs a report in the browser, and look up field names in the Dimensions & Metrics Explorer.
Privacy, on purpose#
- Only totals leave Google: per page, per country, per year. No visitor IDs, cities or single visits.
- Countries with very few visits are folded into “Other”, so nobody can be picked out.
- The service account can view one property and do nothing else.
- The downloaded JSON stays on my PC; only the finished page is published.
Takeaways#
- Google Analytics counts what a static site can’t: a tag in each page sends events, Google adds them up.
- Standard GA4, the Data API, the Cloud project and the service account cost nothing; the limits are quota tokens, and the money starts with Analytics 360 or BigQuery beyond the sandbox.
- A service account with Viewer on one property is all a build script needs; keep its key out of every repo.
- Behind TLS-inspecting antivirus, use
transport="rest"andtruststorerather than fighting gRPC. - GA4 only removes known bots, so don’t publish its numbers yet. That’s part 2.
References#
- How Google Analytics works: Analytics Help, the tag, events and reports
- Known bot-traffic exclusion: Analytics Help, what GA4 filters by itself
- Google Analytics: Google Marketing Platform, “free of charge”
- Analytics 360 and standard property limits: Analytics Help, standard vs 360
- Data retention: Analytics Help, what retention affects
- BigQuery Export: Analytics Help, export limits and costs
- Google Analytics Data API overview: Google for Developers
- Data API quickstart with client libraries: Google for Developers, enabling the API
- Method: properties.runReport and DateRange: Google for Developers
- API dimensions & metrics: Google for Developers, field names and meanings
- Data API quotas: Google for Developers
- IAM pricing: Google Cloud, service accounts are free
- Create service accounts and Best practices for managing service account keys: Google Cloud
- Add, edit, and delete Analytics users: Analytics Help, property access management and Viewer
- GA4 Query Explorer and Dimensions & Metrics Explorer: GA Demos & Tools by Google
- google-analytics-data on PyPI and reference docs: the Python client
- Introduction to gRPC and gRPC environment variables: gRPC
- truststore: the operating system’s certificate store from Python
- About Cloudflare Web Analytics: Cloudflare, the alternative
Earlier: Rebuilding samarthya.me, the series about the move that made this hub possible.